Websays Reports
As a good analytical tool, the Websays Dashboard allows you, in addition to analysing data in detail, to make large-scale reports with attention to detail if necessary. For this purpose, the Websays Reports functionality has around 150 graphs and KPIs organised in predefined reports or in templates where you can fully customise your experience (My Reports).
Predefined Reports
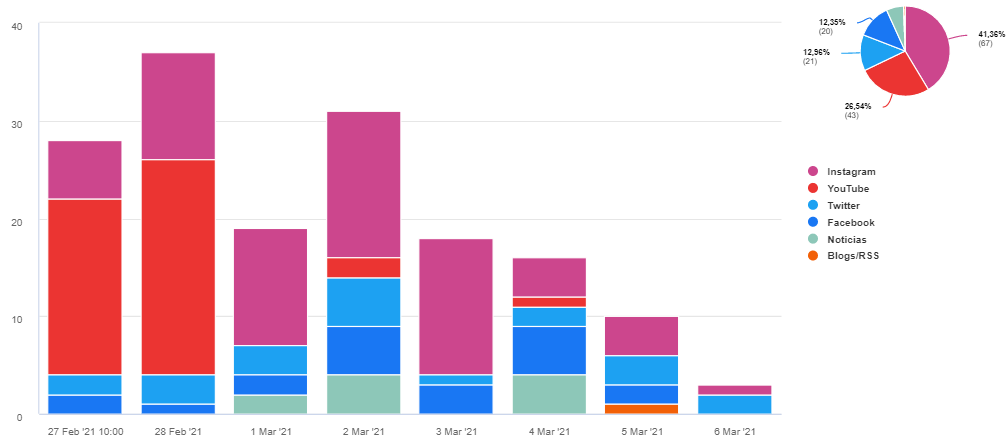
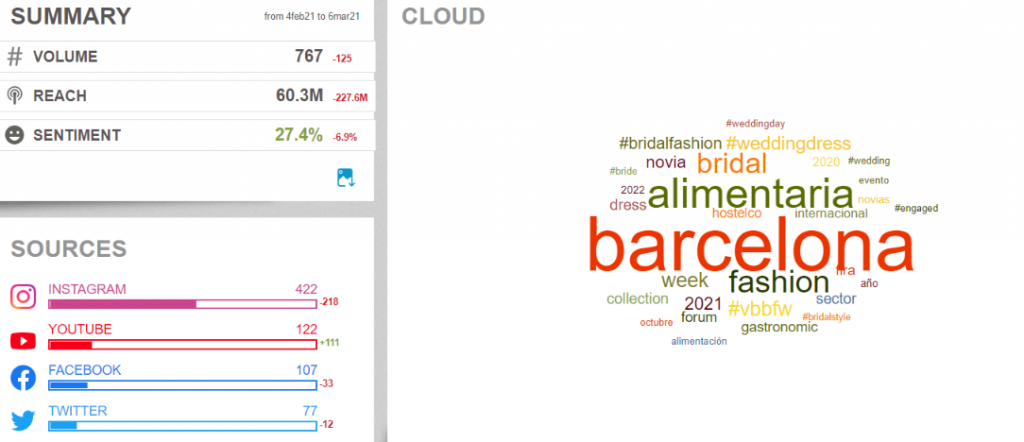
As far as the fixed reports are concerned, you can choose from charts of evolution, sentiment, indicators, Top 10’s and own channels. Some examples you can find in the fixed reports:
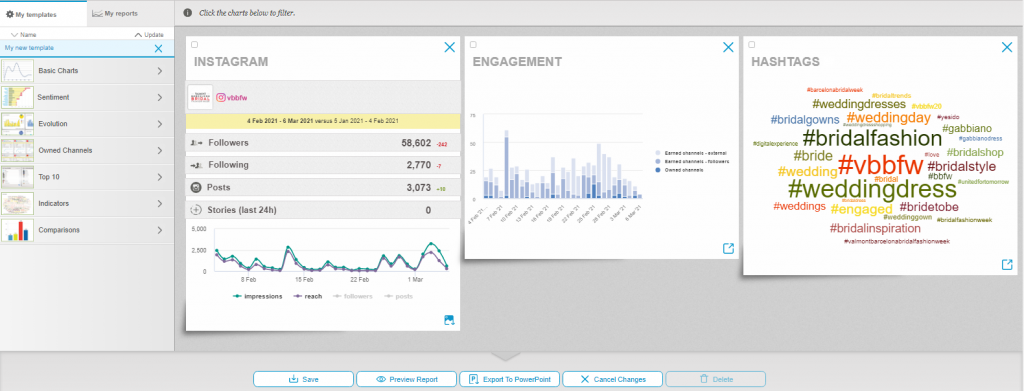
My Reports
The My Reports functionality allows you to, in an easy and intuitive way:
- Create report templates and organise them. In these templates you can include customised graphs with their corresponding titles and comments.
- Creating reports and saving them
- Export the reports to Powerpoint and email them directly to the interested parties
The tool that helps you create, download and send your own customised reports in seconds!
The main advantage of My Reports is the ease and time saving in generating and downloading your daily, weekly or monthly reports because, with a single click, the tool generates graphs and creates a template in seconds. Moreover, by applying time interval filters (last 24h, last 2 days, etc.) your data is updated without modifying the template. So, for example, if your goal is to generate daily reports, once you have the template saved you only have to modify the time interval filter to have the report ready to download or send.
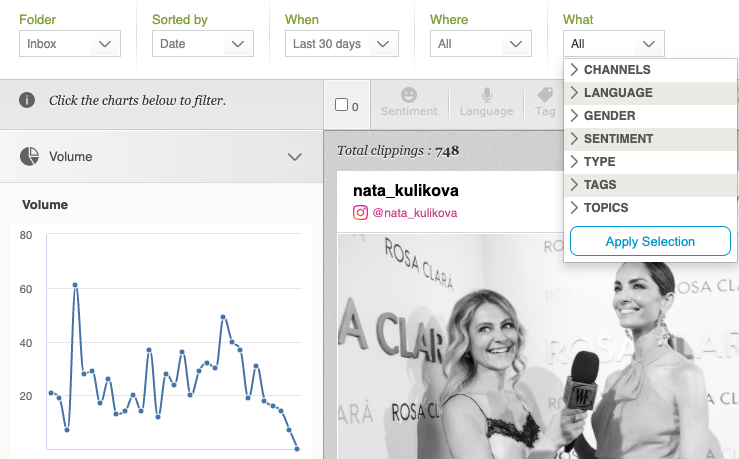
And all these features always with the power of filtering by any insight you might think of, thanks to the Dashboard filtering that applies to all sections:
Would you prefer to focus your attention on other tasks? Our team of analysts will be happy to create your templates and reports for you!