Meet My Reports, the tool that helps you create, download and send your own custom reports in just a few minutes! ??
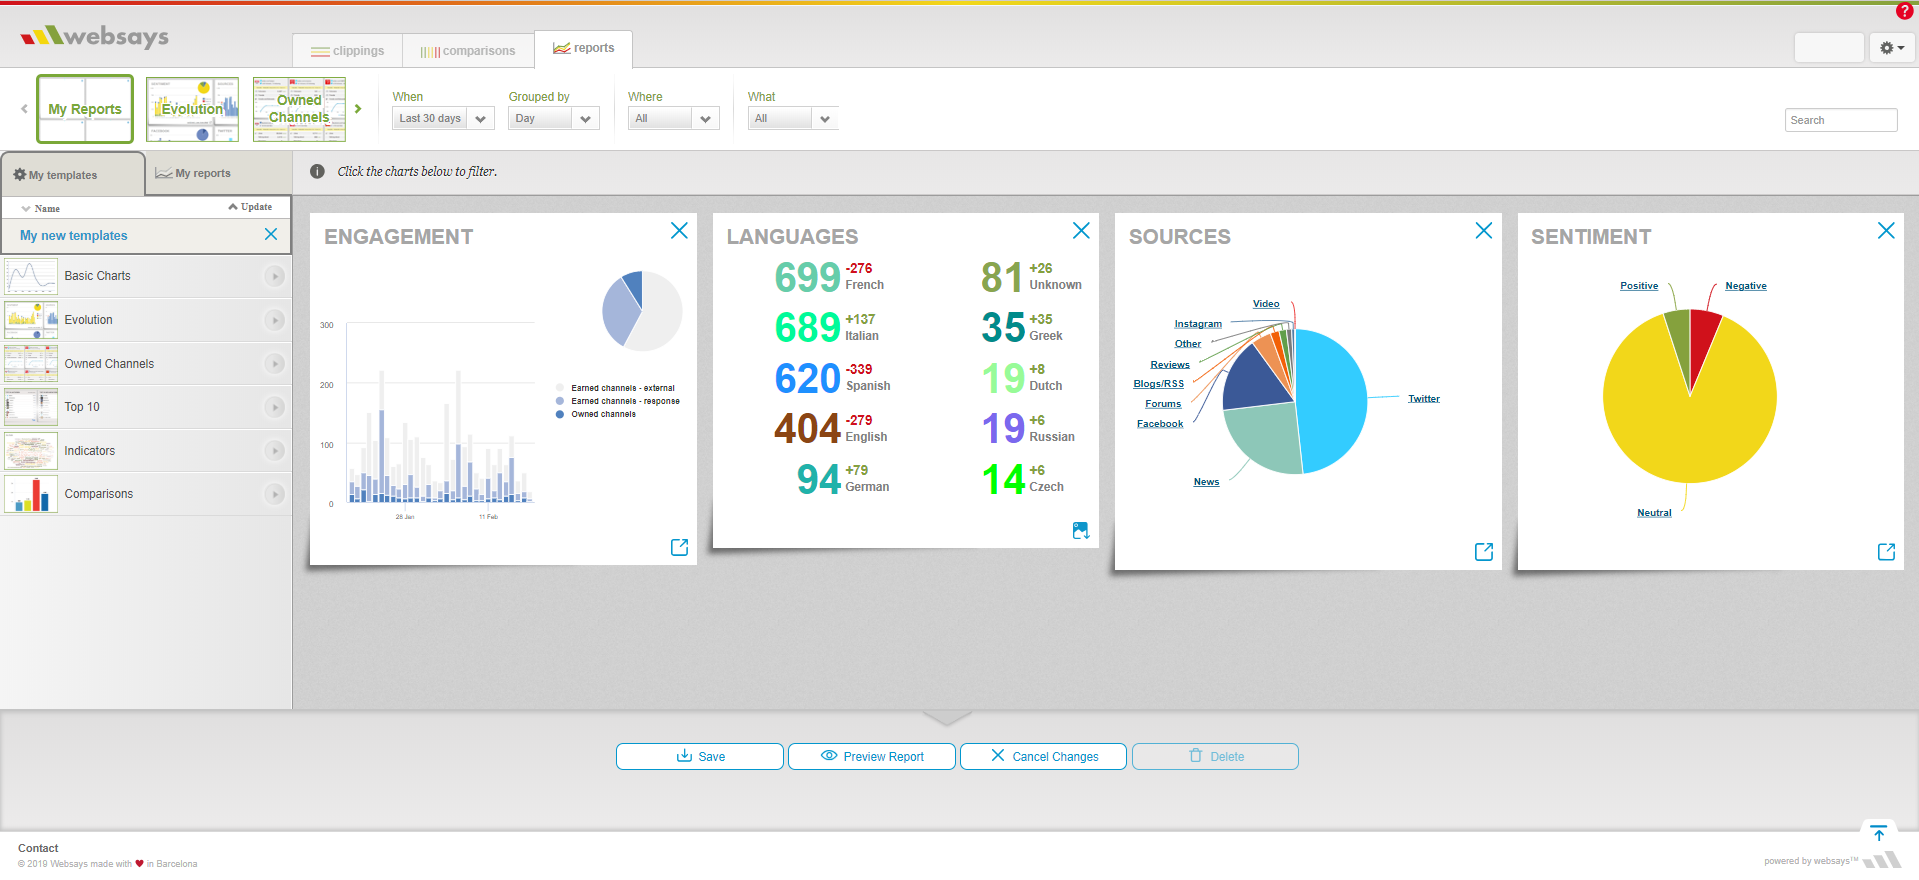
Websays is releasing a new feature! We present a new functionality within our tool, the Easy Dashboard, which allows you to create reports quickly and intuitively, as well as the possibility of downloading them and sending them by email directly to interested people. Here’s a quick look of the new tool:
What advantages does Mis Reports offer?
The main advantage of My Reports is the ease and time savings to generate and download your daily, weekly or monthly reports because, with just one click, the tool generates charts and creates a template in seconds. In addition, applying time interval filters (last 24h, last 2 days, etc.) your data are updated without modifying the template. So, for example, if your goal is to generate daily reports, once you have the saved template you only have to modify the time interval filter to have the report ready to download or send. However, if you still don’t have enough time to create your templates and reports… we do it for you! (you can ask for more information at sales@websays.com).What can you do with this new functionality?
Once you have accessed our Easy Dashboard and the My Reports section, you can start creating the template of your report. To do so, you have at your disposal a great variety of insights that can be displayed in different formats and graphics. Specifically, all the graphics that you can use for your report and that you will find in this section on the left are the following:- Basic charts, which can be shown as a list, pie chart, cloud or bar chart. Within basic charts we find the following insights:
- Authors
- Domains
- Hashtags
- Language
- Media
- Sentiment
- Text
- Terms
- Urls
- Volume
- Evolution, which are graphs that show the evolution of an insight over a period of time, and includes:
- Engagement
- Media
- Sentiment
- Share of voice
- Topics
- Subtopics
- Twitter evolution
- Facebook evolution
- Own channels, which show data from the channels of the Facebook, Instagram, LinkedIn, Twitter and YouTube brand channels.
- Top 10, in which a top 10 list is created (expandable to top 20) of various topics such as:
- Authors
- Influencers
- Mentions
- Social
- Twitter retweets
- Facebook commented
- Facebook likes
- Instagram commented
- Instagram likes
- YouTube views
- Indicators, in which the following insights are displayed in the form of bar graphs or clouds:
- Languages
- Media
- Word Clouds (convertible into a hashtags, emojis, terms or locations cloud)
- Reach
- Sentiment
- Share of voice
- Volume
- And finally, comparisons. In this section you can compare insights of various brands and profiles.
What will my report look like?
Once you have inserted all the graphics, titles and comments in your customised template, you can preview your report and then save it in ‘My Reports’, send it by email or download it in PDF or Power Point format. Your report would look similar to the following:
You want to see it in action?
If you want our analysts to show you how to do it, you can book a demo :
